Update 2/11/24: The original version of this map didn't fully work because the OSHWA api paginates the results it provides. The original version did not take that into account, so only displayed the first 100 certifications. The newly updated version downloads all of the entries before creating the map, so it is actually complete. It also includes a count of the total entries and number of countries with certifications in the header. The new code still more or less works the same way, although there is now an initial step to loop through the api until everything is downloaded. You can find the updated version in the repo referenced below. Also, the API key expires every 100 days, so if you are reading this more than 100 days from 2/11/24 and the map is not loading, that may be the problem. There are instructions for getting your own API key in the repo.
With the recent release of the live OSHWA Open Source Hardware Certification API, I wanted to build a map that tracked the live distribution of certified open source hardware across the globe. You can see the map here. You can see the code here. This post explains how it all works.
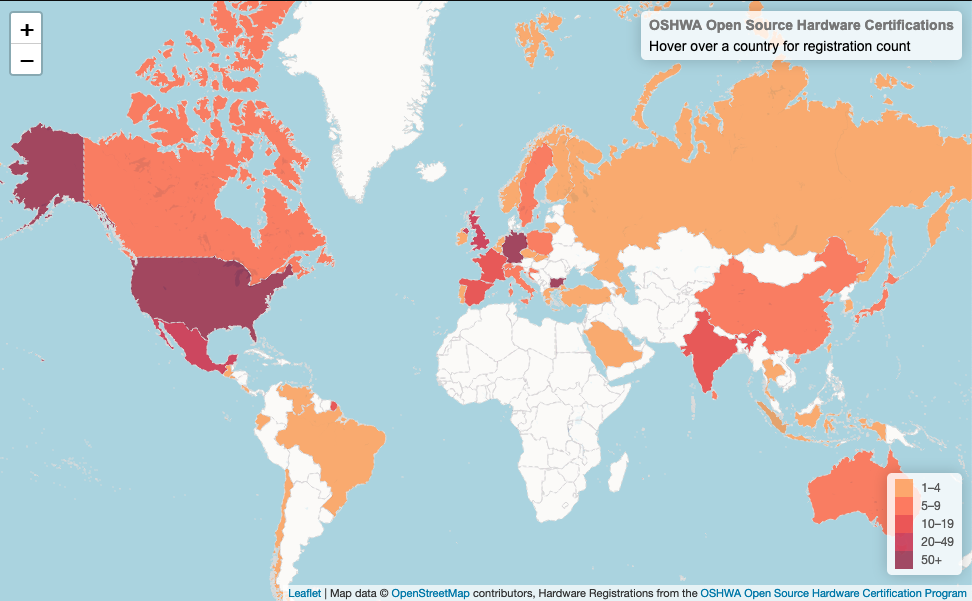
The map I made is called a choropleth. It uses color intensity to compare the number of pieces of certified hardware between countries. I created it using leaflet.js. I chose leaflet mostly because I learned how to use it on a Coding Train tutorial. That tutorial also taught me how to access APIs, which is another piece of this project.
At a high level, creating the map involves a few steps:
-
Download information from the OSHWA Open Source Hardware Certification API to get up to date information about all of the certified hardware.
-
Add the number of pieces of certified hardware to the GeoJSON file. The GeoJSON file is the file that has the geometries for all of the countries so that they can be drawn on the map (and colored appropriately).
-
Load the map.
-
Add a layer on top of the map representing the number of pieces of certified hardware.
Downloading the Current Registration Information
The first thing you need to do for the map is get the current information about OSHWA certifications. Once you get an API key, you can look to the API documentation for example code that shows you how to access specific information in specific languages. For this map we are just going to get all of the OSHWA certified hardware projects.
In order to get the data, you can just copy the example code from the documentation. There are two things to keep in mind when you do this.
First, in order to actually get the data from the API into an object that is useful for javascript you need to parse it into a variable:
var data = JSON.parse(this.responseText);
Second, everything else in this code will happen in the place held by the console.log(this.responseText); in the example code. I think doing this causes everything to wait until the API data has been downloaded but I could be very wrong about that.
Unite the JSONs
Once you have the API data you need to combine it with the GeoJSON for the world. The first step is to create an object that contains the certified hardware count per country. That function is called in the var country_counter = countCountry(data); line. That calls the countCountry() function:
function countCountry(input_json) {
  //create a temporary dictionary in the function
  function_country_counter = {};
  //loop through all of the entries
  for (var i = 0; i < input_json.length; i++)
  {
    console.log(input_json[i]["country"]);
    var country = input_json[i]["country"];

    //this checks to see if the country is in the list
    let result = function_country_counter.hasOwnProperty(country);
    //console.log(result);

    //if the country is not in the dictionary
    if (function_country_counter.hasOwnProperty(country) == false) {
      //console.log('fffalse');
      //add the country with a count 1
      function_country_counter[country] = 1;
      //console.log(function_country_counter);
    }

    //if the country is in the dictionary
    if (function_country_counter.hasOwnProperty(country) == true) {
      //console.log('tttrue');
      //increment the counter
      function_country_counter[country] = function_country_counter[country] + 1;
      //console.log(function_country_counter);
    }
  }

  //return the tempoary dictionary
  return function_country_counter;

}
Once you have the countCountry() object, you can add it to the GeoJSON. The combineJSONs() function adds the HW_COUNT feature to the GeoJSON. It uses what seems like a comically inefficient process for doing this, but that's what some person on stack overflow suggested and it worked, so.....
unction combineJSONs(country_list, geo_json) {
  console.log("hello");

  for (x in country_list) {

    //apparently the best way to add things to the geojson is to
    //loop over the entire thing every time to see if there is a match
    //and then add the entry when there is
    for (let i = 0; i < geo_json.features.length; i++) {
      // if the name of the country blob in the geo_json
      //being iterated upon equals x, which is the current country
      //from the country_list in the iteration
      if (geo_json.features[i].properties.ADMIN === x){
        //add a new elements that is HW_COUNT:<number of HW from the country_list>
        geo_json.features[i].properties["HW_COUNT"] = country_list[x]
        }
      }
    }

    //now loop over everything again and add a HW_COUNT of 0 to everything else
    for (let i = 0; i < geo_json.features.length; i++) {
      console.log(geo_json.features[i].properties.HW_COUNT);
      if (geo_json.features[i].properties.HW_COUNT === undefined){
        geo_json.features[i].properties["HW_COUNT"] = 0
      }
    }


    //prints the updated geojson
    console.log(geo_json);
    //returns the updated geojson
    return(geo_json);

  }
Now you have a combined_jsons object that has all of the geographic information for the countries and the information about how many pieces of hardware is certified in each country.
Make the map
At this point, everything basically follows the leaflet interactive choropleth tutoria. The only real changes I made were:
info.update = function (props) {
  		this._div.innerHTML = '<h4>OSHWA Open Source Hardware Certifications</h4>' +  (props ?
  			'<b>' + props.ADMIN + '</b><br />' + props.HW_COUNT + ' registrations'
  			: 'Hover over a country for registration count');
  	};
Updating this section so the title box talked about OSHWA
function getColor(d) {
    return d > 50 ? '#800026' :
        d > 20  ? '#BD0026' :
        d > 10  ? '#E31A1C' :
        d > 5  ? '#FC4E2A' :
        d > 1   ? '#FD8D3C' :
              '#FFFFFF';
  }
changed the thresholds and colors associated with those thresholds
function style(feature) {
  		return {
  			weight: 1,
  			opacity: 1,
  			color: '#d9d9d9',
  			dashArray: '3',
  			fillOpacity: 0.7,
  			fillColor: getColor(feature.properties.HW_COUNT)
  		};
  	}
layer.setStyle({
      weight: 1,
      color: '#666',
      dashArray: '',
      fillOpacity: 0.7
    });
slightly changed the weight and colors of the borders
map.attributionControl.addAttribution('Hardware Registrations from the <a href="https://certification.oshwa.org/">OSHWA Open Source Hardware Certification Program</a>');
changed the attribution light_number
var div = L.DomUtil.create("div", "legend"),
  			grades = [1, 5, 10, 20, 50],
  			labels = [],
  			from, to;

  		for (var i = 0; i < grades.length; i++) {
  			from = grades[i];
  			//to = grades[i + 1];
        to = (grades[i + 1]) - 1;
changed how the legend to match the other cutoffs.
That's the long and short of it. I hope you take some time to play with the API and build a more interesting visualization than I put together.