This is a simple project to visualize the surface of the earth with a LED matrix. It is a way to play with open topographical data.
The concept is pretty straightforward. Imagine a rectangle slowly sliding over the surface of the earth. The topology of what is in the rectangle is displayed on a 32x16 LED matrix.
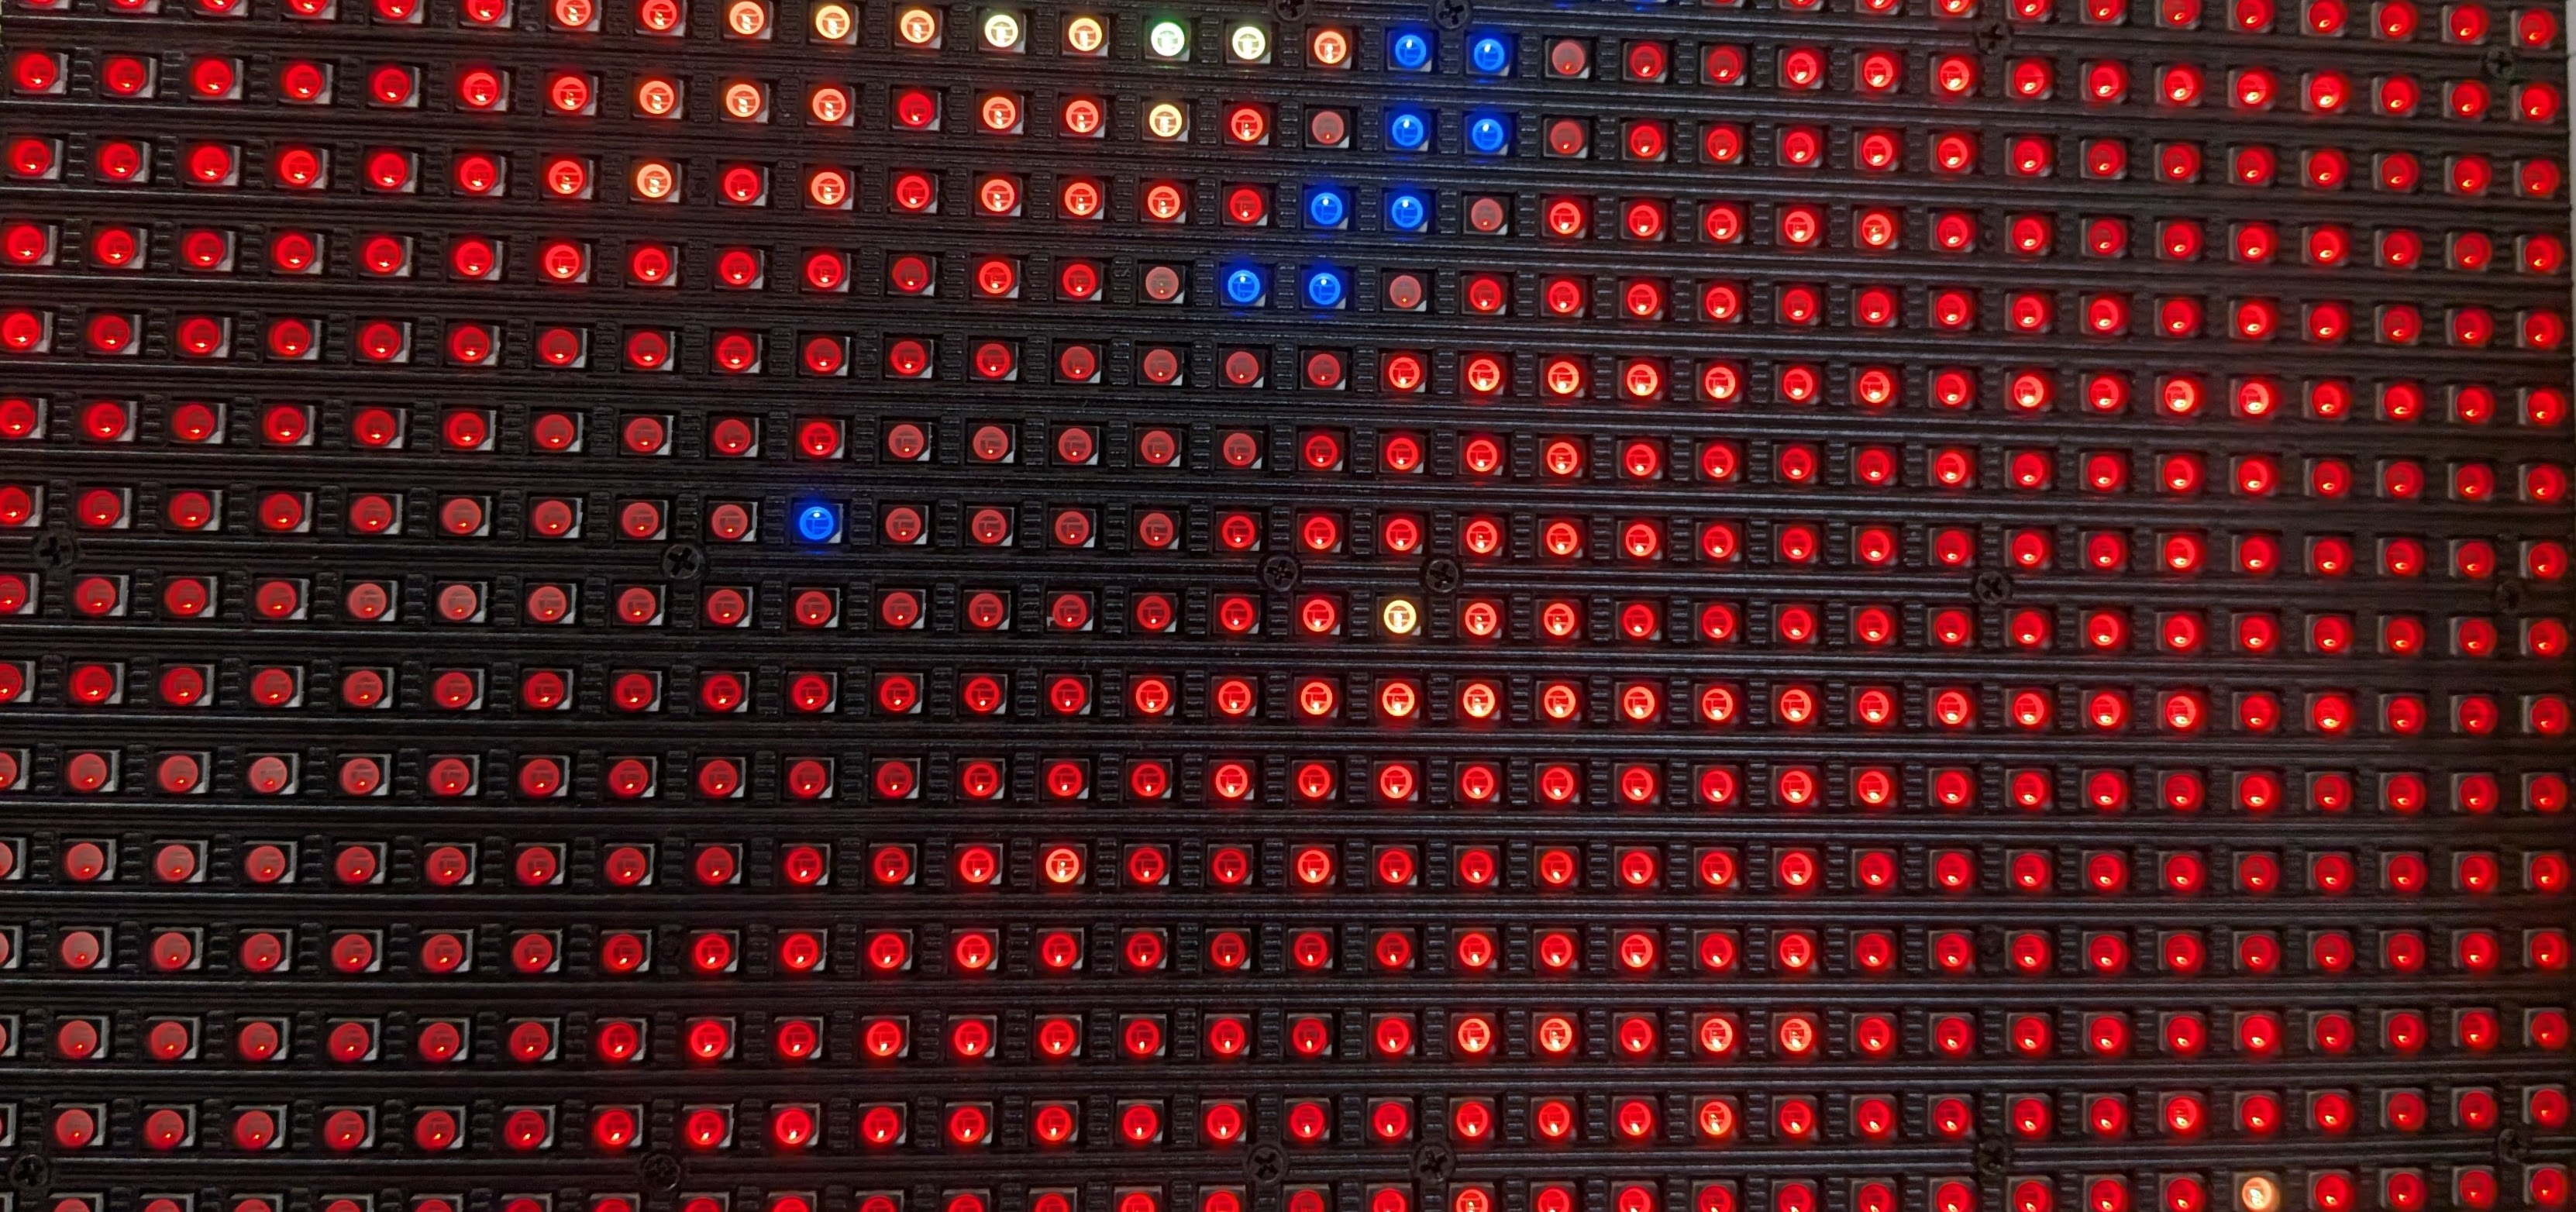
I used this matrix driven by this hat. It is currently running on a pi 3 that I had lying around, but basically any pi will do. The data is all local so it does not need to be connected to the internet to work.
However, connecting it to a local network gives you the ability to access the web page displaying the current position:
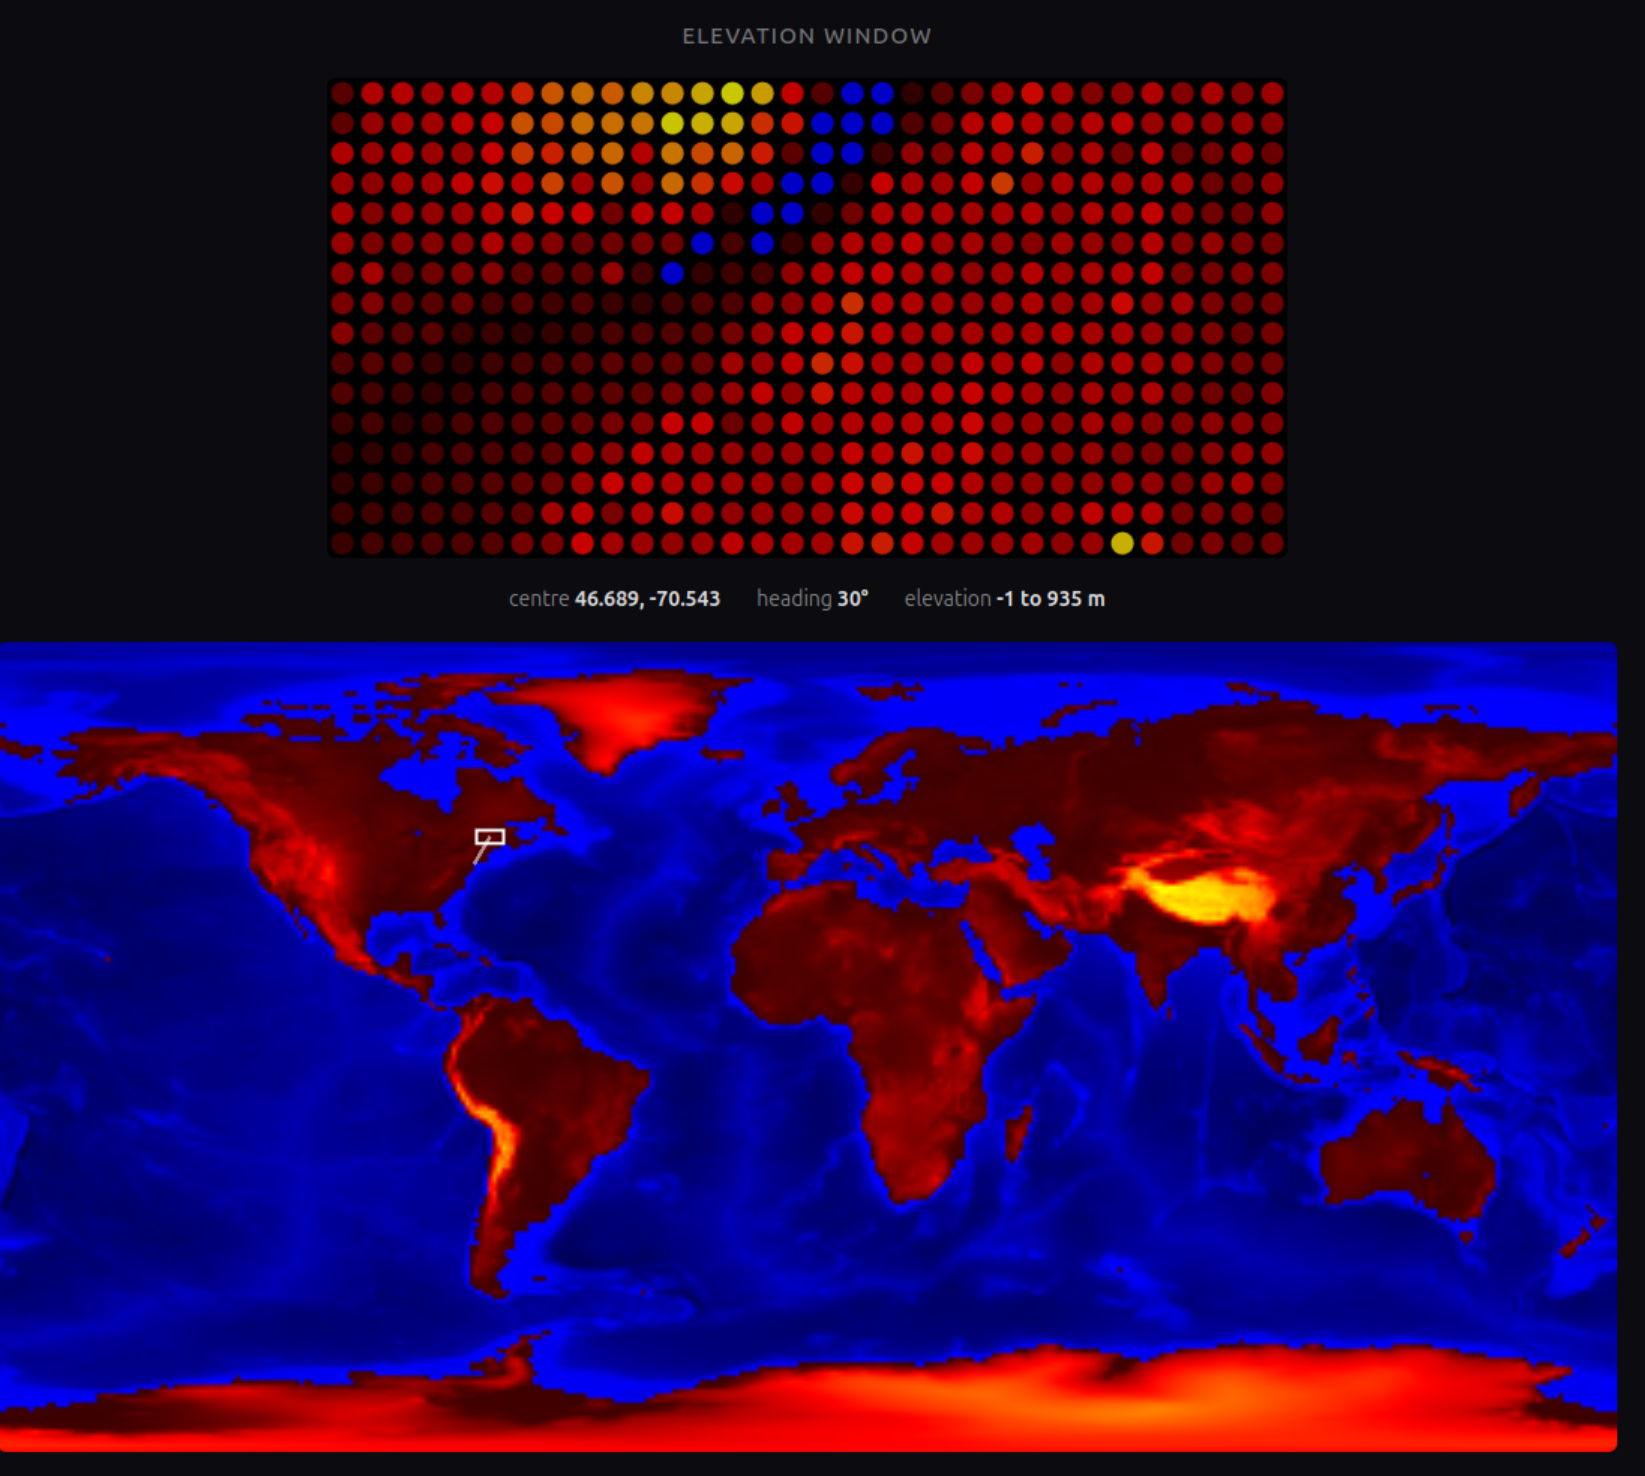
This project had been sitting on my todo pile for years. The primary blocker was that I was trying to set up an API for the elevation on the pi, which would then be accessed by a python script. The problem was that the package I was trying to use did not have an image compatible with the pi.
In the end it turned out not to matter. Instead of using an architecture where the script reads the data via an API, this version just reads the data directly.
The full repo is available here: https://github.com/mwweinberg/elevation_grid.