By "pretty easy" I mean "even I can do it" - an exceedingly low bar. It appears that the secret is kepler.gl, New York City open data, and a little bit of python. Click here to play around with my map yourself.
I have been wanting to try and do a neat map-based thing for a while but did not really have a good project to use as a hook. That changed when I found out that New York City makes film permit data available as part of its (excellent) open data portal. My neighborhood is always having streets closed off for shooting and I was curious how it compared to the rest of the city.
Preparing the Data
Getting the data is pretty easy - just download it from the film permit data site. While that data set is good, it isn't quite ready to be used. The data set has a lot of information about location - borough, zip code, streets closed, etc. What it doesn't have is specific latitude and longitude. Those numbers are going to be key to placing the dots on the map so I needed a way to get them. Since there are tens of thousands of entries, I needed a robot to figure things out.
Fortunately there are robots that are good at this kind of thing. Reverse geocoding APIs allow you to submit address information and in return they will send you lat/long. They can even work with not-quite-address data, like cross streets and zip codes.
In order to make things work, I wrote a python script to open the file from the City, send the useful bits to the geocoding API, and add the lat/long to a new file. I decided to use the Mapbox geocoding API because Mapbox is great.
It turned out that the data needed some cleaning before the API would give me what I needed. The first issue was that I had forgotten how to deal with the fact that the first row was a header row. Since I am lazy and there was only one input file I just deleted the row in the input file and manually pasted it back into the output file at the end.
in terms of more substantive issues, sometimes there were many locations associated with a single permit, so I decided to break the entries up by location. This code breaks up multiple-address entries into individual entries:
addresses = list(row[6].split(', '))
The for loop then works through each address to make it its own entry in the output file:
for address in addresses:
If there were multiple addresses there were also multiple zipcodes. I admit that I cheated here. Instead of figuring out how to map the multiple zipcodes to the multiple addresses, I just picked the first zip code and used it for all of the addresses. My hope was that it would be close enough:
zip_split = list(row[13].split(', '))
first_zip = zip_split[0]
After playing with some test data I realized that at least 30% of the addresses I sent were not recognized by the geocoder. Helpfully the geocoder returned some address in West Africa when it was confused, so it was easy to find the errors. After playing around a bit I figured out that stripping the 'and' and 'between' from the addresses made the geocoder more accurate:
address_no_between = address.replace('between', ' ')
address_fully_stripped = address_no_between.replace('and', ' ')
I also realized that the order of terms mattered for the geocoder. Specifically, putting the street names at the end of the term seemed to help:
geocoder_entry = borough + ' New York City ' + first_zip + ' ' + address_fully_stripped
print("GC entry = " + geocoder_entry)


#looks up the address and pulls the lat and long
response = geocoder.forward(geocoder_entry)
counter += 1
collection = response.json()
lat = collection['features'][0]['center'][1]
#writes it to the csv
#row.append(lat)
long = collection['features'][0]['center'][0]
That greatly reduced the number of errors from the geocoder, although it did not eliminate them. In order to try and salvage something, if the geocoder returned a bad lat/long I resubmitted the query with just the first street name:
short_geocoder_entry = borough + ' New York City ' + first_zip + ' ' + short_address
print("Short GC entry = " + short_geocoder_entry)
response = geocoder.forward(short_geocoder_entry)
counter += 1
collection = response.json()
lat = collection['features'][0]['center'][1]
long = collection['features'][0]['center'][0]
row.append(lat)
row.append(long)
output_writer.writerow(row)
That got the accuracy rate high enough for me to stop worrying about it.
Using the Data
Once I had a correctly formatted data set it was time to move over to kepler.gl. At this point things became comically easy. The steps were just:
- Go to kepler.gl
- Upload the output file (make sure you have re-added the header row)
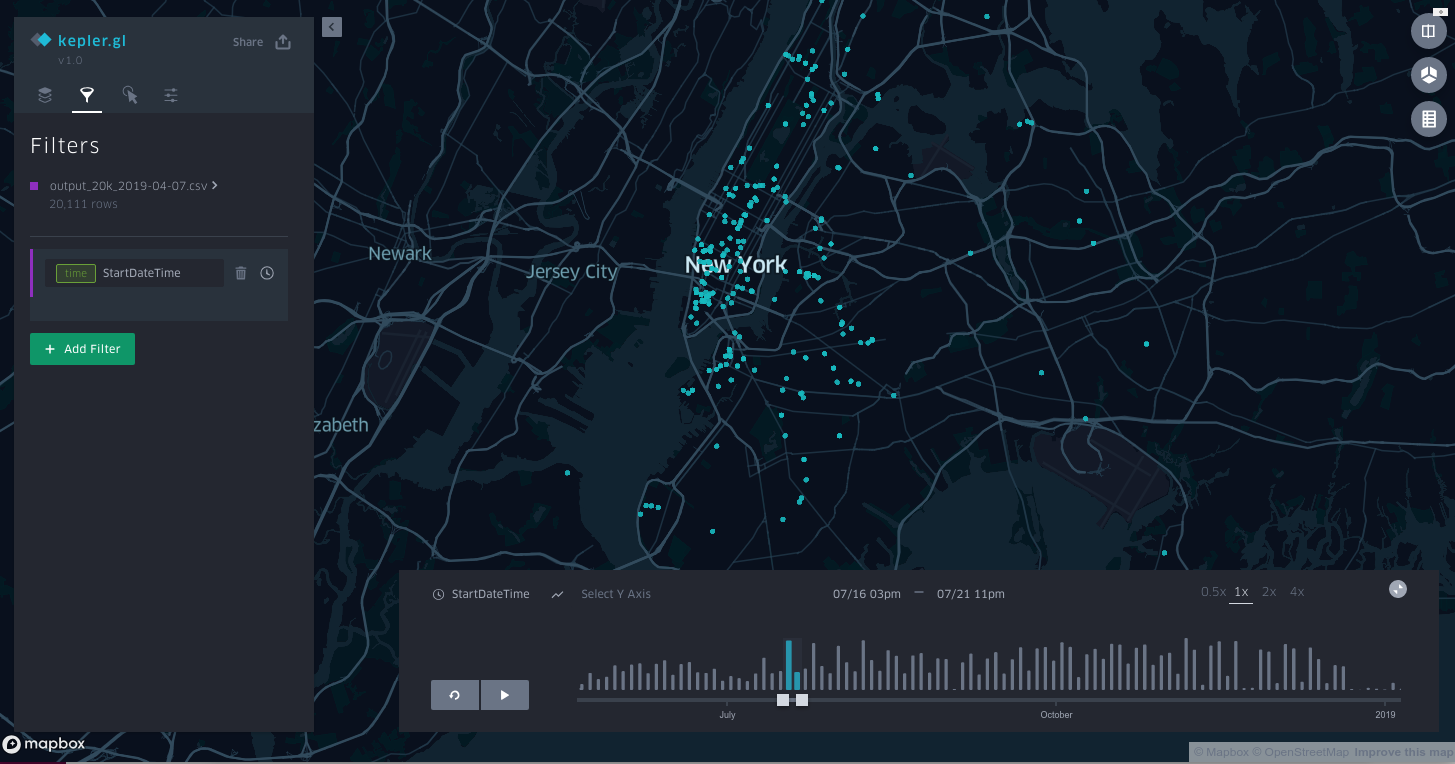
- Add a filter tied to the field "StartDateTime"
That is the whole process. Kepler automatically recognized that I wanted to show the locations over time and added the timebar to the bottom of the screen (click here to play with the real one):
If I wanted to add hotspots over time (instead of individual dots) that was as simple as adding a new layer:
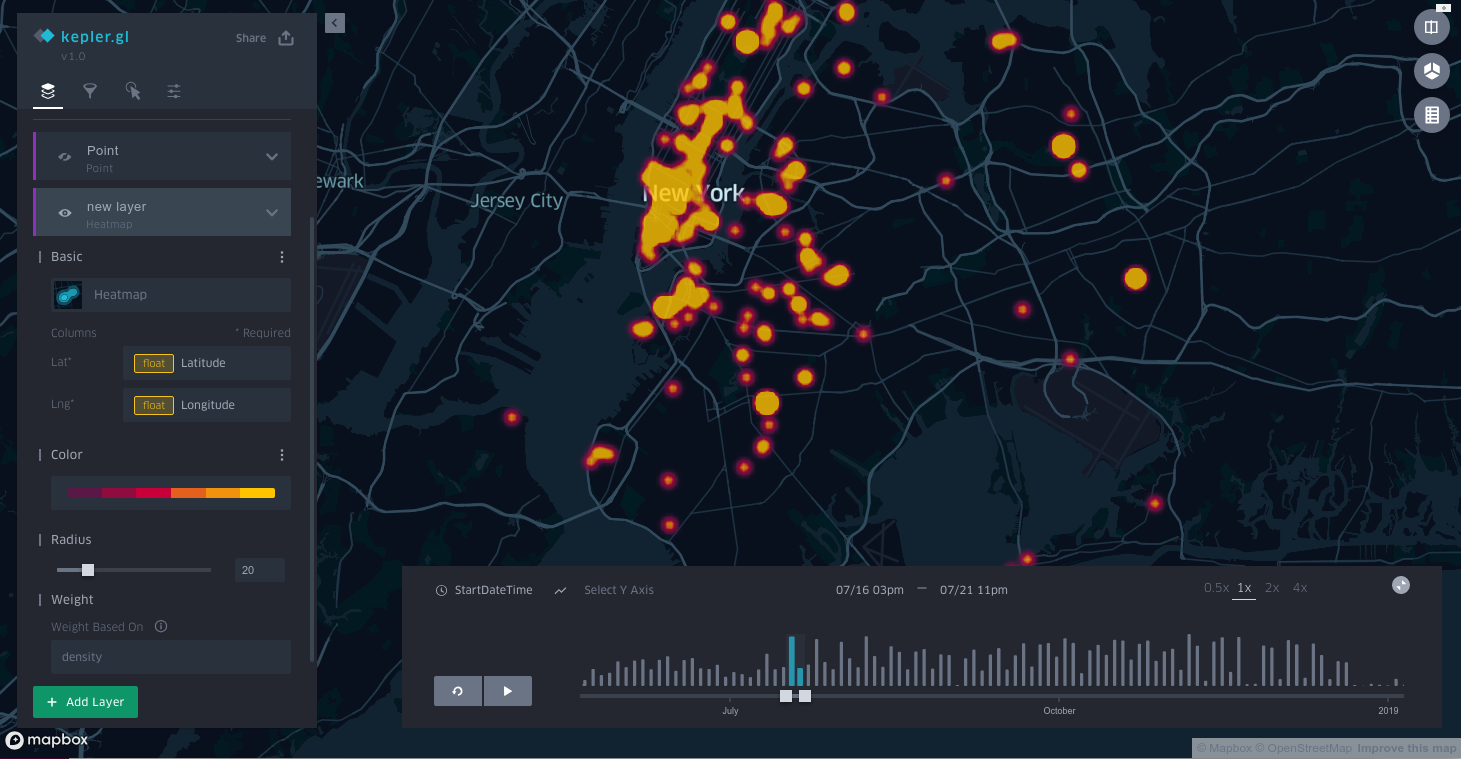
That's basically it. I am excited to use this visualization for more things and I hope this post helps prove to you that pretty much anyone can make real looking map visualizations.